
Colleagues,
On New Year’s Day I came across a copy of a BBC special that aired last
year. Those of you who follow the TED lecture series (and I’m not
suggesting you should, as a lot of them are nonsense) may recall a presentation
a few years ago (note A) by Swedish global health expert Hans Rosling.
The presentation, while informative in its own right, was less interesting for
the data than for the manner in which Rosling used computer presentation
software to show how the data changed over time. This year’s BBC special
took the subject of statistical data to a whole new level. Entitled “The
Joy of Statistics” and narrated by Rosling himself like some sort of Nordic
James Burke, the episode explains how the world is awash in all kinds of data,
and what makes this period in history fascinating is the fact that we are only
now coming into possession of the computer processing power and capacity
necessary to enable us to make the most of it. If you can find (a) an
hour out of your schedule, (b) a computer system that actually allows you to
watch streaming video (yeah, I know – crazy, eh?), and (c) the intestinal
fortitude to spend 60 minutes listening to a Swedish guy who is genuinely
passionate about numbers, then I strongly recommend you watch it (note B).
One of the neat things discussed in the video
is an in-depth look into how Google Translate works. Back in the 80’s,
having gotten sick of my Smith-Corona, I talked my way into the CMR mainframe
lab so as to be able to use the CAD/CAM system to write term papers. This
being the pre-WYSIWYG era, I had to learn to code the desktop publishing
software, which required that I routinely seek assistance from one of my
computer-engineering comrades. He’d had to work out the coding
system himself in order to make progress on his own fourth-year memoir, which
was developing language-recognition software. What drove him squirrelly
was the irregular nature of the English language. Computers are
designed to work within and by rules – “if THIS, then THAT” – and English
is notorious for observing few rules, and breaking those it DOES
observe with gleeful abandon.
As a composite language with both Germanic and
Latin roots and words imported from dozens of other languages, the
irregularities of English have been causing computer programmers to tear their
hair for years. My colleague had decided to take a rules-based approach
to language, and was trying to design a short programme that would tear a
sentence apart into recognizable and actionable chunks. Let me tell you,
nobody goes through coffee like a computer science major trying to make sense
out of grammar textbooks. He ultimately failed (in his quest, not his
studies), because there were too many exceptions to the rules.
Google, though, has succeeded. Most of
us, I imagine, have used Google Translate at least once over the past few
years. It’s amazingly accurate – and, if you’ve watched Rosling’s video,
what’s especially amazing is that it does it all without rules.
The software works purely by statistical analysis and the power of large
numbers. By trawling websites and making comparisons between
previously-translated texts, the software simply develops an ordered list of
probabilities of accuracy between the origin language and the target language,
and provides the user with a “best guess”. It also allows the user to
submit superior translations for consideration. It’s absolutely ingenious
– and it’s only the tip of the iceberg when it comes to the fantastic array of
uses to which we might be able to put the unprecedentedly massive amount of
data that is now available to us, and the power of tools like ultra-high speed
computers and the Internet to manage it.
Google really is a pioneer in the field of mining information from floods of
data. Just before Christmas they came out with something new and, in my
view, even more interesting. For some years, Google has been engaged in a
tremendously ambitious project: the digital scanning of every book ever
published. Stop and think about that for a second – every book ever
published. Apart from the legal ramifications of such a thing (as you can
imagine, the lawsuits for copyright infringement are already underway), the
research possibilities for the readers of such a database are nothing short of
staggering.
But what if you don’t read them?
Google’s watershed insight into the problem of machine translation was to
minimize context; to ignore the gestalt of a piece of text and look simply at
the immediate context of words next to each other, to throw away the rules and
examine only numerical patterns. What sort of things can you learn by
doing that to a massive database of published works?
Enter Google’s “n-gram viewer”, a trial bit of
software that’s still in the testing phase. In order to avoid copyright
problems, the fellow who proposed the project to Google in 2007 – Erez
Lieberman Aiden, a mathematician following a Ph.D. in genomics at Harvard –
suggested converting the scanned book database into a n-gram database: “a map
of the context and frequency of words across history”.[note C] This would
enable scholars to conduct research on the scanned database without actually
reading the books, and without forcing Google to violate millions of copyrights
by releasing the scanned-in data.
How big a database are we talking about,
anyway? Well, the human genome is a “book” of about three billion
characters written using only four letters (the amino acids adenine, cytosine,
guanine, and thymine). The Google database is more than two thousand
times as big; it currently consists of 2 trillion words taken from 15,000,000
books, or one-eighth of all of the books published in every language since the
Gutenberg Bible was printed in 1450.[note C] That’s an awful lot of
data. To make it searchable, the database had to be converted into
n-grams: unigrams (single words or word-character groups), bigrams (double
words or word-character groups), trigrams, and so forth. This required
the database developers to make decisions about how to deal with, for example,
contractions, compound words, hyphenated words, apostrophes, and so on, with
separate decisions made for each of the ten linguistic corpora under
development. The full details of how they went about this task can be
found in their paper, which was published in Science last month.[note D]
Obviously, such an approach can be
problematic. According to a review of the new software, researchers
wrestling with the database came up with a number of surprising
revelations. The first was that books contain what one lexicographer
called “huge amounts of lexical dark matter”. Even after excluding proper
nouns, for example, “more than 50% of the words that ended up in the n-gram
database do not appear in any published dictionary”. Standard reference
works tend not to include neologisms even if they are in routine use (e.g., “deletable”),
and they also miss genuine but obscure words (e.g., “slenthem”, apparently a
type of musical instrument).[note C] However, these weaknesses, while not
exactly compensated for, are overridden by the immense power of the search
engine and database combination which, if it breaks down at the micro or
technical levels, at least produces fascinating results at the macro or culture-wide
levels.
One use of the database has been to track the
impact of political interference on ideas. When the database developers
examined the German corpus of published works, for example, it showed a marked
drop-off in the 1930s in citations of well-known Jewish or “degenerate” artists
(e.g., Picasso) when compared to similar references in the English corpus,
which remained steady during the period. Other uses tested include
tracking the relative influence of thinkers over time. One example given is
the comparative frequency of mentions of Darwin and Freud.

As you can see, Darwin held a commanding
lead in the late 1800s and early 20th Century. Interestingly, perhaps as
a consequence of the contemporary fascination with psychoanalysis, Freud
bypassed Darwin from the 1950s to the mid-1990s, before plummeting
again, with Darwin finally looking set to surpass Freud a few years ago
(according to one review of the program, he did).
The possibilities are virtually endless, and the only restriction is the researcher’s imagination. As with any research tool, of course, the value lies in the precision with which search parameters are designed; it would be a mistake, for example, to compare “President Clinton” to “President Bush”, since there have been two of the latter.
The possibilities are virtually endless, and the only restriction is the researcher’s imagination. As with any research tool, of course, the value lies in the precision with which search parameters are designed; it would be a mistake, for example, to compare “President Clinton” to “President Bush”, since there have been two of the latter.

In fact, the data clearly reveal the
double hump that is inevitable when you have a Clinton between two
Bushes. If you didn’t know that
there had been two President Bushes, though, the double hump would pose a
statistical mystery (although you might logically infer from such a double hump
that there must have been two different “President Bushes” whose respective
impacts on the zeitgeist peaked roughly fifteen years apart).
Similarly, a search for references to “Mao
Zedong” reveals virtually nothing before the 1970s, and the numbers don’t
really spike until long after his death, which is indicative not of a new
emphasis on the Chinese communist dictator, but rather of the ongoing
replacement of the Romanized transliteration of his name by the
Pinyin transliteration.

At the same time, though, a comparative search
between “Mao Zedong” and “Mao Tse-Tung” fails because the software interprets
the former as a bigram and the latter as a trigram. The only way to get a
comparison is to do two separate searches - and doing so reveals precisely when
the former spelling overtook the latter in English-language publications.
Adding additional search terms is fun,
too. Returning to the Bush-Clinton comparison above, here’s what you get
if you add “President Reagan” to the mix, and roll the search period back to
1970.

The Gipper, it seems, had a more extensive
impact on literary culture during his administration than any of
his successors. If we throw Carter into the search as well (moving the
search back to 1900, as we’re going progressively back in time here)...

...we find that Jimmy outweighed both
George and Bill, but not Dubya or Ron. This is a little
counterintuitive; one would expect Clinton to have had a greater impact on
English-language publishing over the course of two terms than Carter had over
the course of one.
Peak times are also interesting; it would not
be entirely accurate to conclude that references to Slick
Willie peaked during his annus horribilis (1999 and the height of
“Monicagate”), because references to Carter peaked just as he was handing
the White House over to Reagan, and references to Reagan and George, too,
peaked right at the end of their terms. There’s a certain logic in this;
one would naturally expect references to individual Presidents to continue to
grow as long as they are in office, and to decline after they leave office.
The beauty of the database and the n-gram
software, of course, is the ability it gives us to probe deeper into
history. Dumping Jimmy and throwing “President Lincoln” into the search
terms (and expanding the search back to 1850), we see that Honest Abe had a far
greater impact on English publishing than any recent president.

More interesting is that fact that instead of a
normal (bell) distribution, as has been the case with the past five
Presidents, Lincoln gives us a much bumpier graph, with several “comeback
periods” around 1890, 1905 and 1940. Presumably the latter reflects
Roosevelt’s incessant references to Lincoln during the 1940 Presidential
campaign; it would be interesting to mine the data further to see why, though,
Abe’s name bumped in 1890 and 1905. There also seems to have been a
slower but more enduring Lincoln resurgence under way since the mid-1980s.
Well, since we’re already doing this, let’s
expand the search to 1750 and include the big guy himself, President
Washington. The result is…well…lacklustre. But maybe there’s a good
historical reason for that – nobody remembers Washington for being President,
they remember him for his other accomplishments.

If we look at three possible permutations of
names and titles – George Washington, General Washington, and President
Washington – and if we switch to the American English corpus (i.e., books
published in the US), then we get some very interesting results.

The key pattern that leaps out at us is that in
books published during the French and Indian Wars, Washington was more likely
to be known as “George”. During the
Revolution, “General” overtook “George”; and that remained the case until about
1885. References to “President
Washington” have, by contrast, always been relatively insignificant, even
during his time in office; and since 1885, books published in the US have
been far more likely to refer to Washington by his Christian name than by his
military title or presidential titles. Literary convention? Authorial
preference? Reverence for “The Indispensable Man”? Presumably historians would
have a better grasp of why references to Washington follow the above pattern.
In the meantime, the “Three Washingtons” problem illustrates
why, when using a database like Google’s n-gram viewer, you have to be
sure that you’re comparing apples to apples, and not to pomegranates.
For this reason, while it might be fun,
therefore, to compare – for example – Washington, Jefferson, Franklin and
Adams…
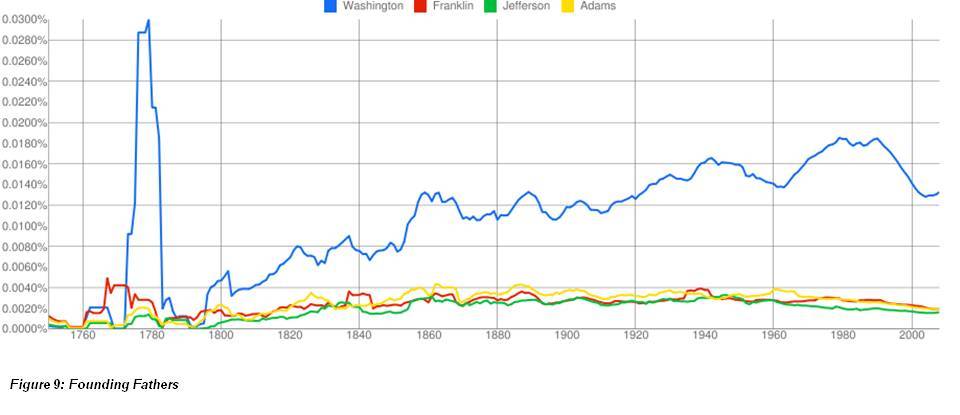
…the results are not really reliable, even if
you’re only using the American English corpus. It’s easy, for example, to
identify the frequency peaks that correspond to the presidencies of John Adams
and his son, John Quincy; but “Adams” is not an uncommon name, and the software
doesn’t know which one you’re talking about unless you tell it. And you can’t
compare “John Adams” with “John Quincy Adams” because of the
bigram/trigram problem.
Obviously, as with any other powerful
data-mining tool, the possibilities for enjoyment are endless. God, you
might be interested to know, has enjoyed a commanding literary lead over Satan
for the past half-millennium. Religion, meanwhile, after
centuries of running ahead of Science, was caught up in the 1920s and
overtaken during the Second World War, but appears to be surging
ahead again in the past five years.

Interest in sin, always a staple of
literature, has likewise evolved in fascinating ways over the past 500
years.

Pride has been a pretty consistent leader over
the centuries, except for the late 17th Century, when wrath suddenly got
popular (and peaked again during the Seven Years’ War and the Napoleonic
Wars - though not, interestingly, during the far more destructive wars of the
20th Century). Envy’s been up and down, while sloth and gluttony
have barely made it onto the radar. Greed was briefly popular in the
mid-1600s, but then more or less vanished until it grew during the
fin-de-siècle malaise of the pre-War period, and has more or less
corresponded to the rise and sustained popularity of socialist political
theory. Finally, lust popped up at various times in the late 16th and
17th Centuries, but then disappeared until the Pax Britannica, and
hasn’t really changed much, proportionally speaking, since Oscar Wilde
fell afoul of Victorian society’s “don’t ask, don’t tell” conventions.
What about that little bump in 1520?
Well, this shows where databases become problematic. That whole column is
due to one book - Martin Luther’s “Open Letter to the Christian Nobility of the
German Nation”. Because the data are normalized on an annual basis, a
single book takes on special significance if the number of books published
in any given year is low.
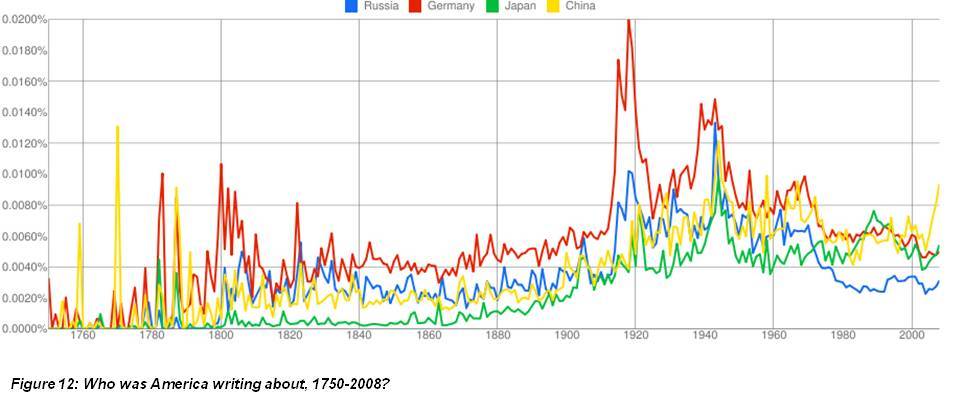
Back to the engine. Emphasis on different
countries in US publishing has shifted significantly over the past 250 years…
…while dessert preferences over the past four
hundred, in the English-speaking world at least, have not. I would love
to see an explanation for the big valley between 1950 and 2000 in the chart
below. America certainly didn’t give up on dessert during the explosion
of the middle class.

Political flavours have varied, too, with
different “-ists” predominating at different times over the past century.

Fascists were big in the 40’s,
Marxists overtook communists in the 80’s, and everybody other than
anarchists declined precipitously over the past 20 years – which, not
coincidentally, is when Islamists first showed up, overtaking anarchists in the
last decade, and running neck-and-neck with fascists.
Meanwhile, the appearance of different diseases
in the English lexicon not only tracks closely to historical epidemics (at
least in the places where English-language books were being written and
published), but also reflects the extent to which various diseases tended
to dominate popular culture.

The fact that tuberculosis and AIDS have
consistently been mentioned more often in literature than far more lethal
diseases like influenza (apart from a brief bump during the 1918-20 Spanish
Influenza epidemic) and smallpox reflects the role that
disease plays as a cultural referent. There are clear literary
parallels between the 19th-Century victim of consumption wasting away in a
sanitorium, and the 20th-century HIV patient wasting away in a hospice.
Diseases like anthrax, smallpox, influenza and plague kill their victims
too quickly to make useful literary characters. Oh well,
at least cholera got the attention it deserved.
Speaking of cultural fascinations, the database
allows us to compare how deeply some terms and ideas have made their way into
our collective lexicon.

Witches and ghosts were big throughout the 17th
Century, with demons picking up in its latter half (and getting a massive bump
in the 1690s), dominating most of the 18th Century, and never really declining
in popularity for the next 200 years. Ghosts took over around about
the battle of Jena, and haven’t relinquished the lead
since. The incidence of mummies in published books peaked from
about 1820-1920, the period of greatest interest and discovery in
Egyptology, and so probably is more reflective of Carter penetrating
Tutankhamen’s tomb than of Abbott and Costello subsequently meeting The
Mummy. Vampires, meanwhile, were non-existent until the early 1800s and
remained fairly low throughout the 19th Century. Even the publication
of Bram Stoker’s ”Dracula” did not cause an up-tick; vampires got
their first real bump during the filming and release of Murnau’s “Nosferatu” in
1921-22. Werewolves enjoyed a brief blip around the time of the US Civil
War due to a sudden flurry of books about eastern folklore (probably as a
result of the number of British officers, soldiers and civilians flitting about
southern China and the Raj), but otherwise didn’t make much of an impact until
the past decade. The real story, of course, is how the vampire phenomenon
jumped a little in the 1970s, and then exploded after the mid-1980s as part of
a general upsurge in interest in the occult, likely (one hopes!) as a
result of fiction. In all of this, it’s the discontinuities that are
especially interesting. One wonders why, for example, mention of
ghosts in English-language books declined from 1950-1980, while mention of
witches and demons increased.
As you can see, there’s more than enough data
in the Google book set to keep you busy for the rest of your natural life, and
the n-gram viewer engine provides enough functionality for analysts to be able
to tease interesting tidbits out of the deluge.
For those interested in designing their own
experiments, the raw n-gram datasets are available for download here: [http://ngrams.googlelabs.com/datasets].
Warning – these are not small files. The American English bigram set
alone consists of 100 zipped files, each consisting of 152 megabytes of
compressed data. The danger isn’t only in the scope of the information;
it’s also in the likelihood of misunderstanding of results. One Berkley
linguist called the analyses produced by using the search engine and database
combination “almost embarrassingly crude”; but as with all tools, refinement
comes with time. Google’s next target is multi-gram contextual searches,
which will enable researchers to examine how the use of given words in context
changes over time, enabling linguists (and historians, political scientists,
and other students of the way the world works) to track “semantic shifts” over
history. That would be a truly remarkable achievement, and one of immense
interest to historians.
Even if the tool itself doesn’t command your
attention, the Michel et al. paper is worth a read (see note D - free
registration required). And if you want to try your own comparisons, the
viewer is here [http://ngrams.googlelabs.com/],
and information about it can be found here [http://ngrams.googlelabs.com/info].
Cheers - and a belated Happy New Year to all!
Cheers - and a belated Happy New Year to all!
//Don//
Notes
A) http://www.gapminder.org/videos/hans-rosling-ted-talk-2007-seemingly-impossible-is-possible/
B) http://www.gapminder.org/videos/the-joy-of-stats/
C) John Bohannon, “Google Opens Books to New Cultural Studies”, 17 December 2010 [http://www.sciencemag.org/content/330/6011/1600.full.pdf].
D) Jean-Baptiste Michel, et al., “Quantitative analysis of culture using millions of digitized books”, Sciencexpress.org, www.sciencexpress.org, 16 December 2010, Page 1, 10.1126/science.1199644. (Free registration required)
E) Obama doesn’t make the list because the database search function ends at 2008.